Inakalum uses locally recruited data-gathering agents to walk the streets and, using our proprietary smartphone app, they photograph, geotag and categorise street assets and public domain places, up to 10,000 datapoints per square kilometre.
Street Assets
Inakalum’s agents walk the streets and, using our proprietary smartphone app, they photograph, geotag and categorise street assets and public domain places as they walk. Because the agents stand in front of every asset they log, they get individual high-resolution images of all assets. These high-res images allow Inakalum to use machine learning to analyse assets and add additional metadata.
Because our data-gatherers walk the streets, they are not hampered by street-level or overhead obstructions, such as parked cars or street furniture, that hamper other data-gathering technologies that rely on drive-by, satellite or streetview imagery.
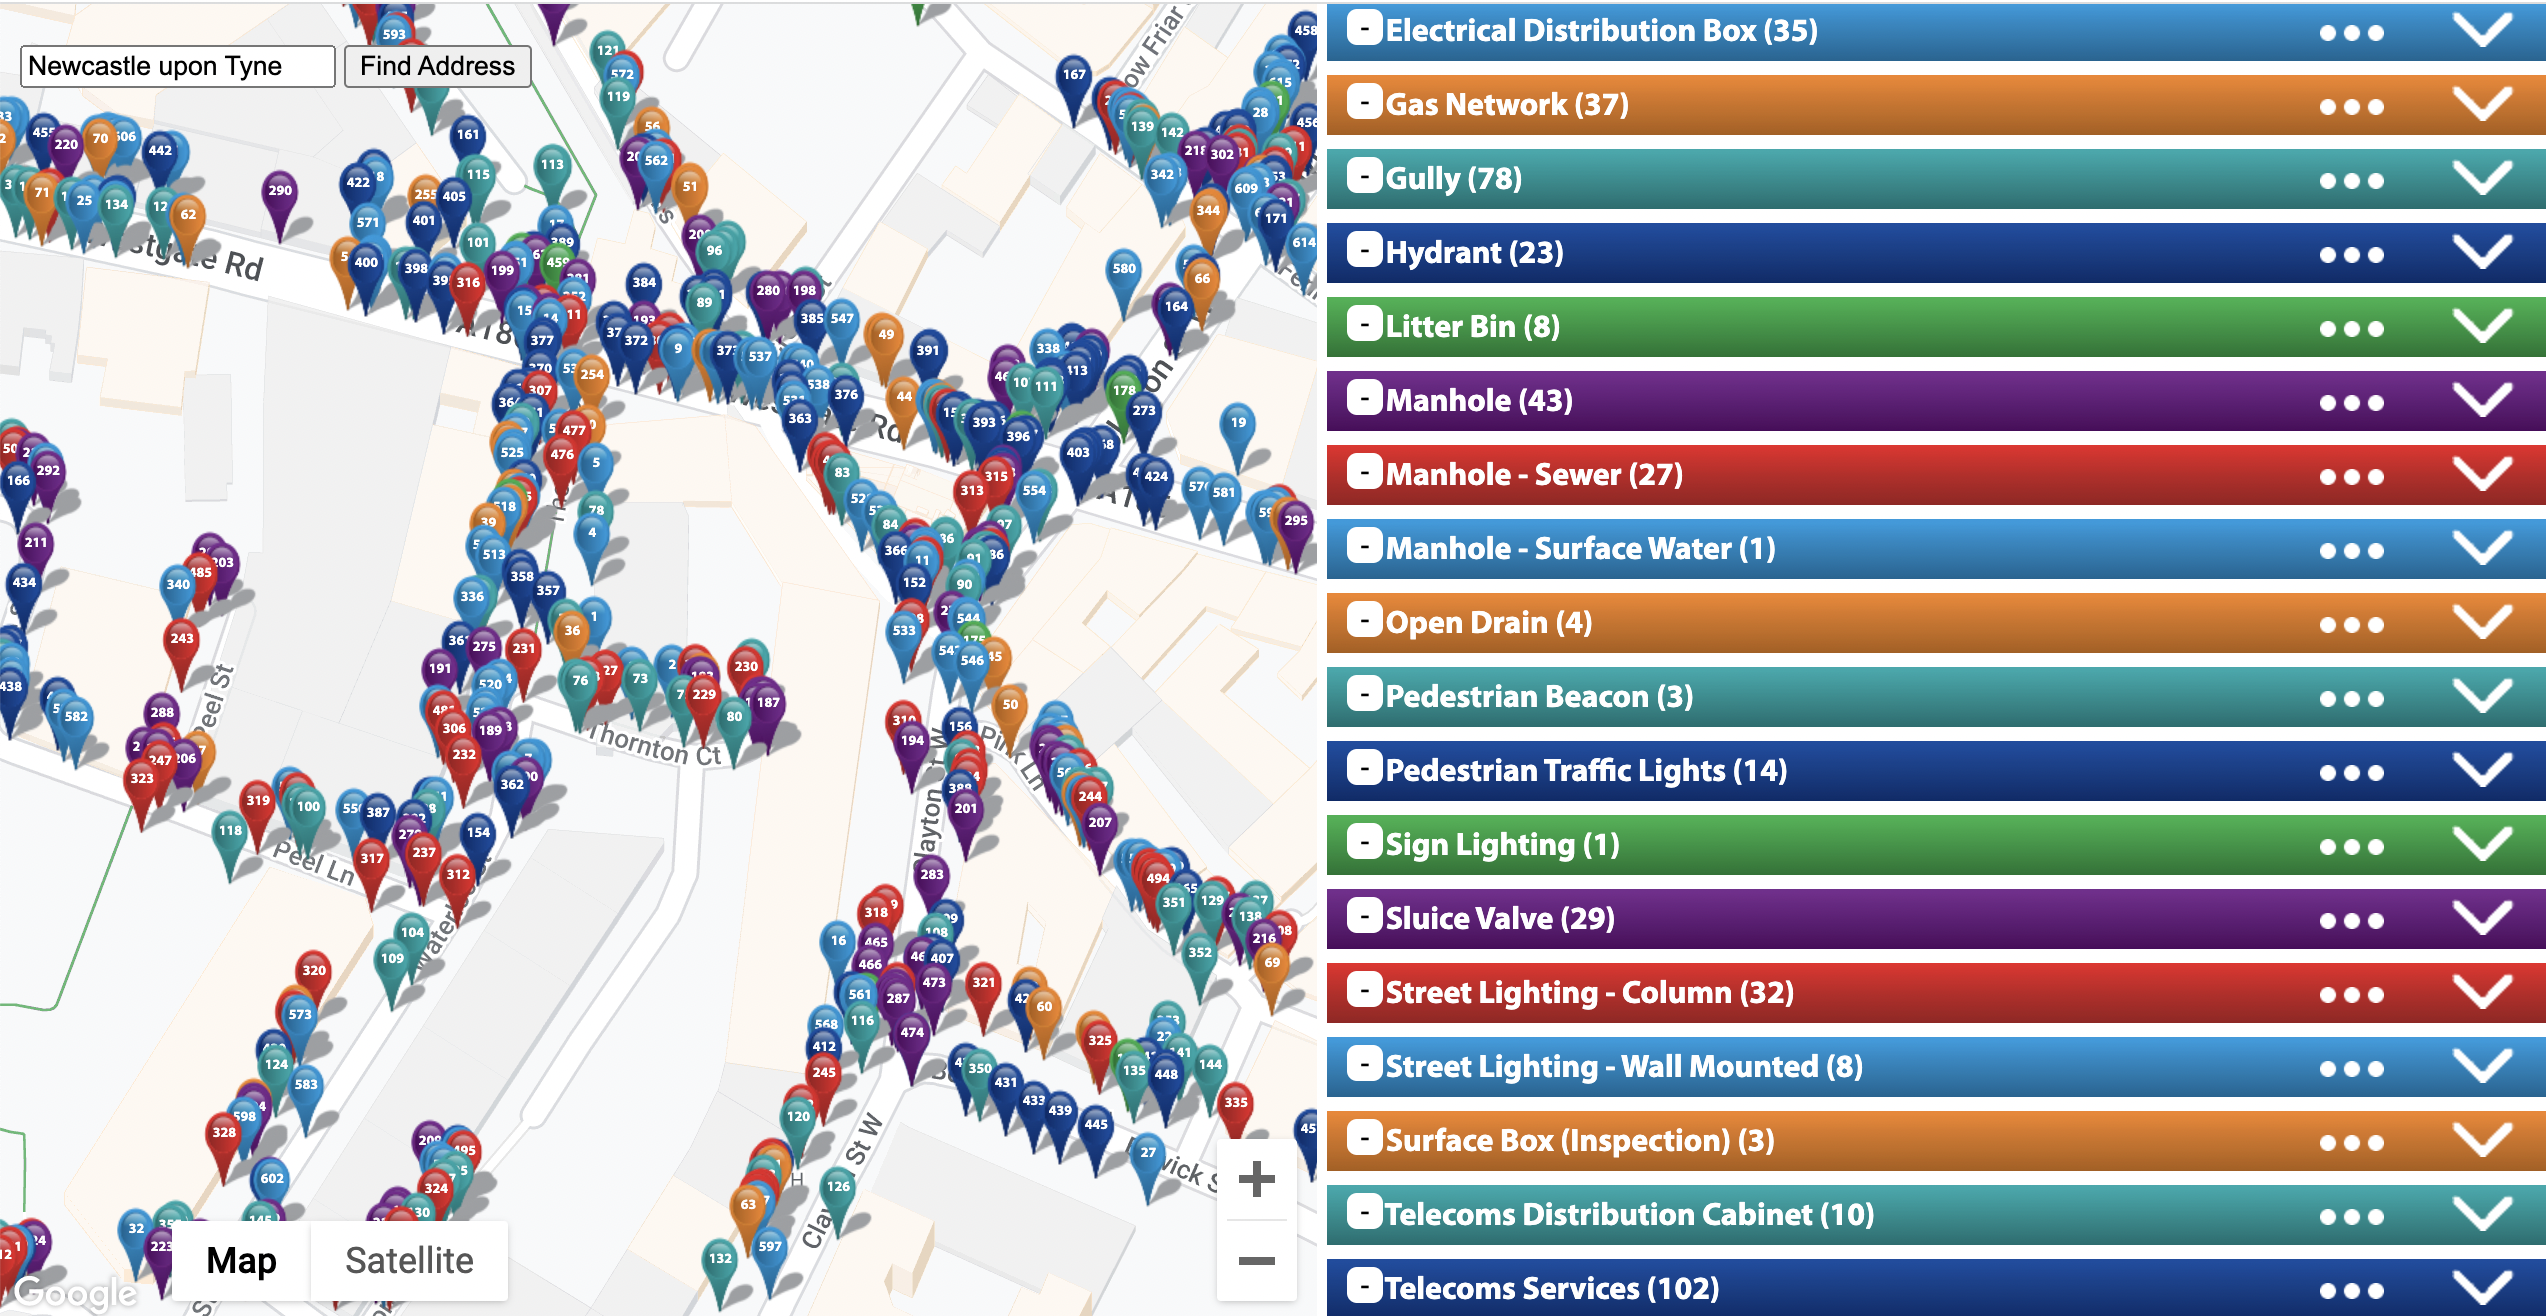
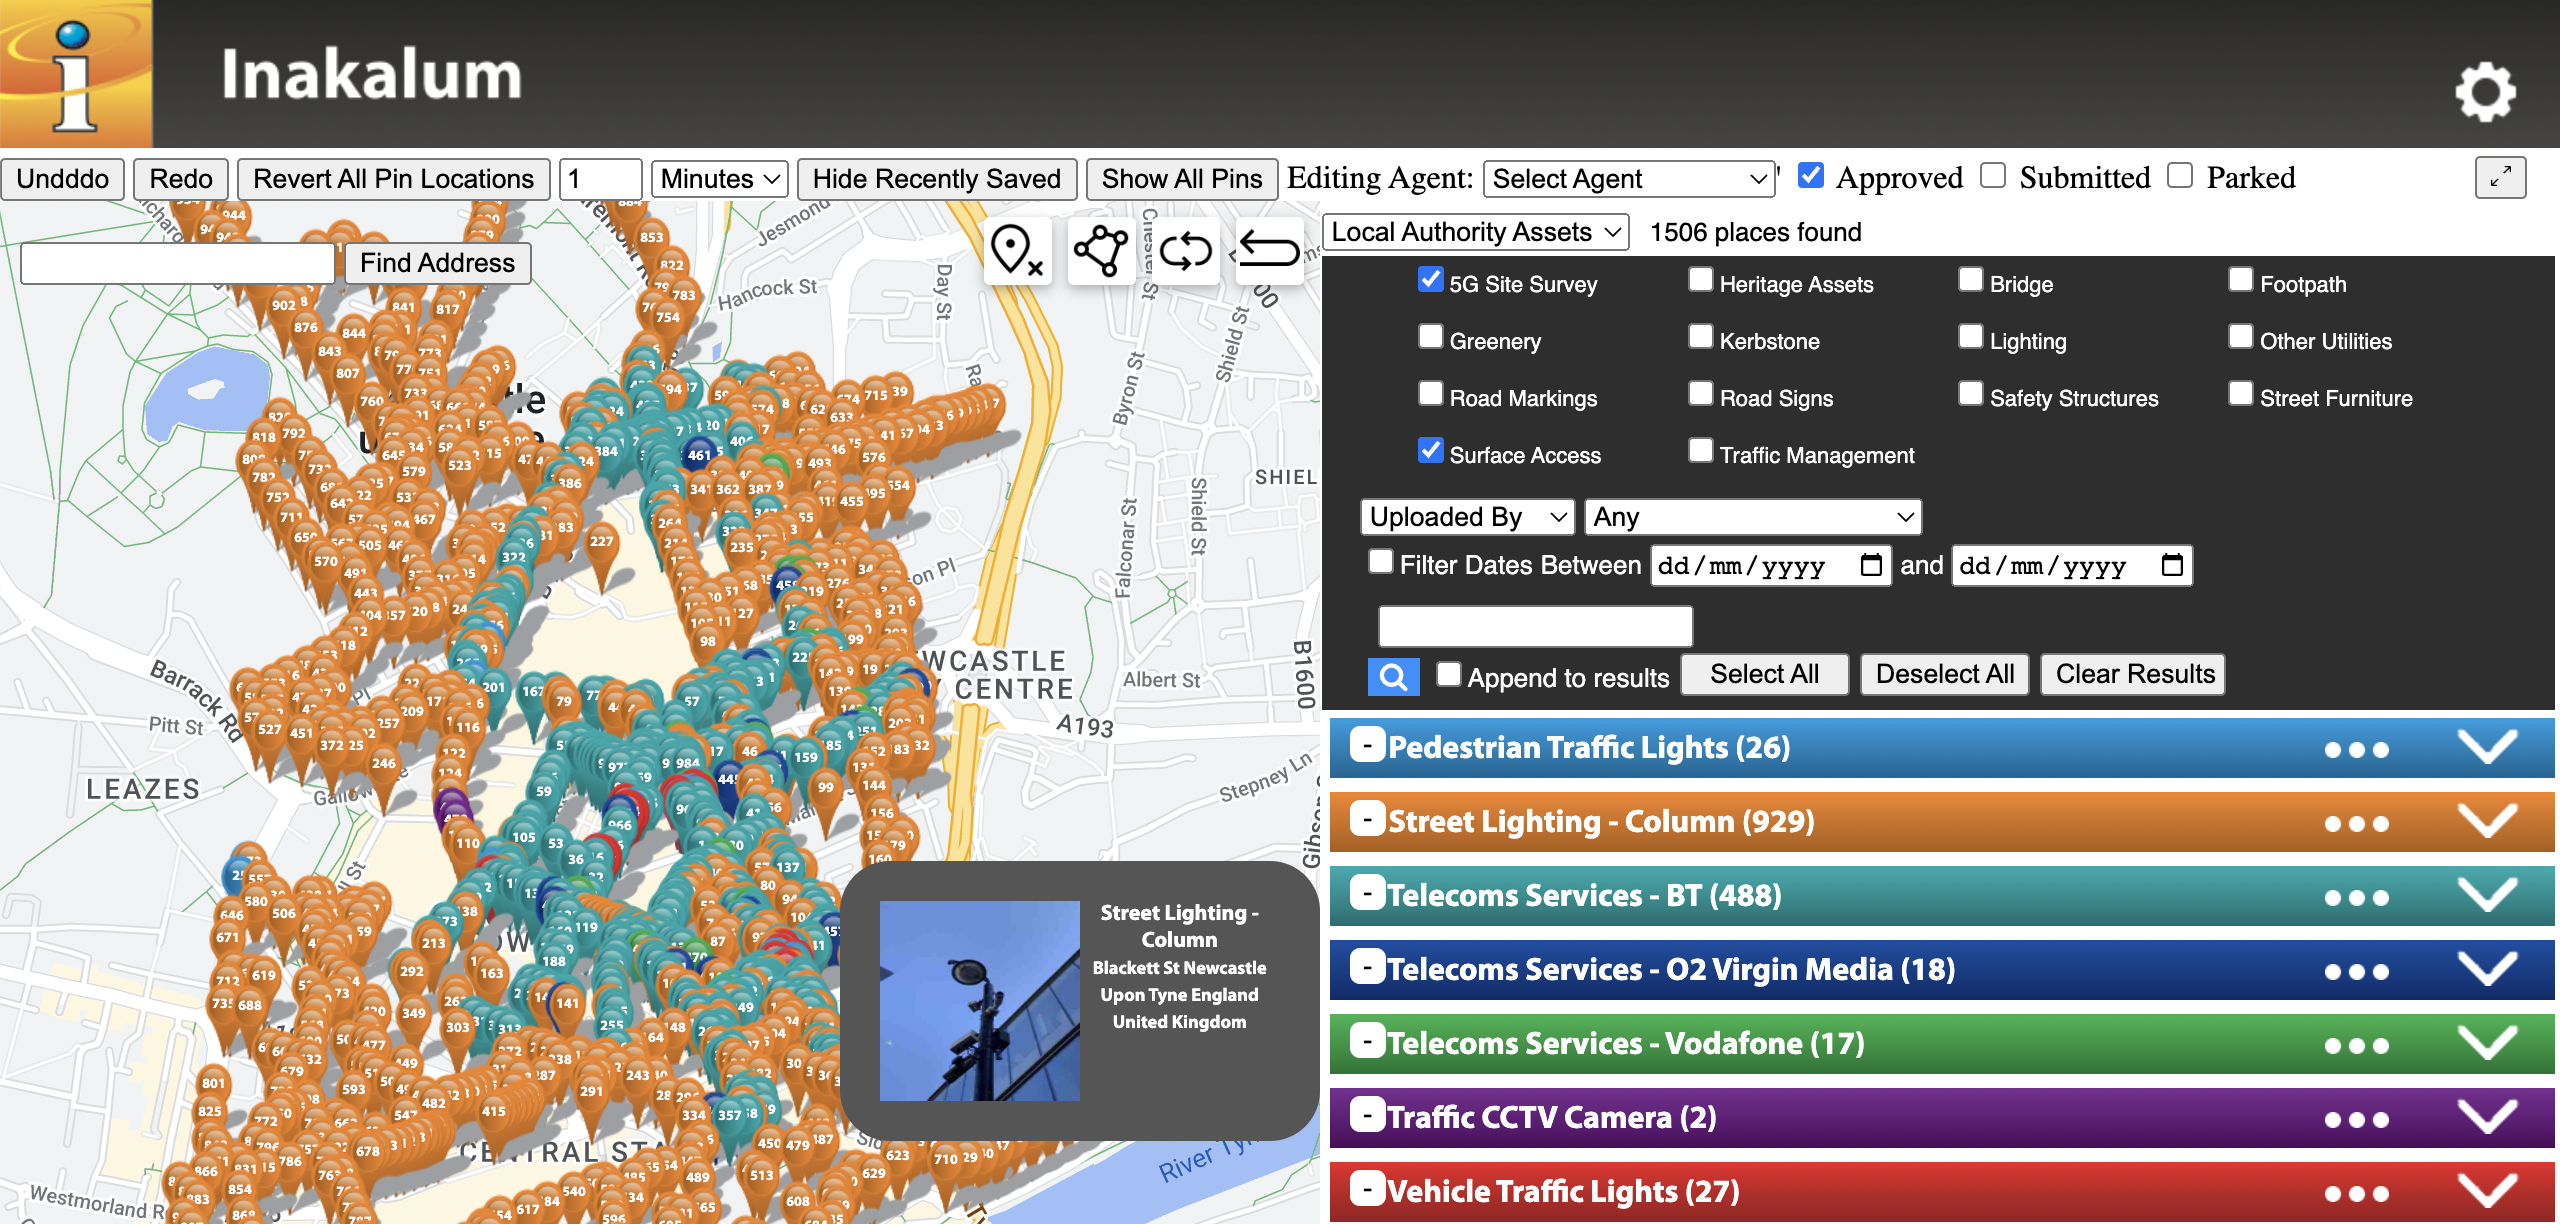
Street Asset Sample – Newcastle upon Tyne
Public Domain Places
As well as street assets, we also map public domain places including businesses, places of interest, public services & amenities, parking, etc. Together with the street assets data, our public domain data offers Local Authorities and commercial companies a complete geospatial solution for finding anything in an area.
Our map-based search engine allows layering of datasets so you can mix data from our street asset and public domain datasets, making it an invaluable resource for Local Authority planning and operational staff, and private sector companies who supply products or services to the public sector.

Public Domain Places With Layering Of Datasets
Easy To Use
Our map-based search engine has a range of features that make it very easy to use, with no training required:
- Pin Hover – hovering over any map pin will produce a pop-up of with an image and details of the asset or place
- Category Search – search by multiple categories and sub-categories
- Keyword Search – searching by keyword will match place names as well as categories and sub-categories
- Append Results – run multiple searches and append results to previous searches
- Results List – as well as the map pins, results are displayed in a list
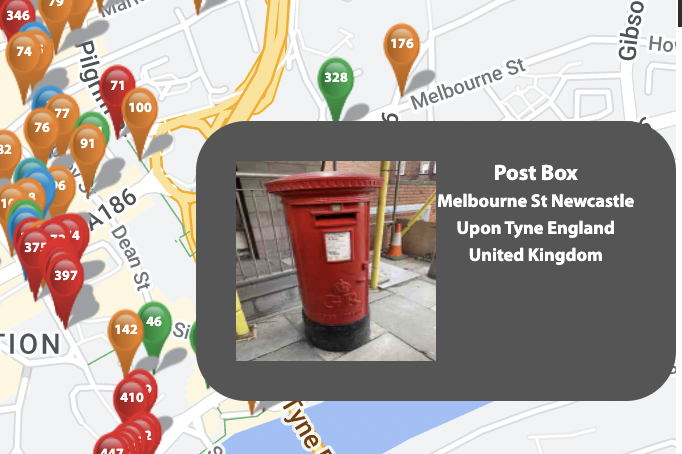
Hovering over any map pin shows a pop-up with image and details
Heat Map Analysis
Inakalum’s heat map tools can make it very easy to find exactly what you’re looking for in our very rich geospatial data. For example, Fig. 1 is showing the distribution of Takeaway outlets (top right), Convenience Stores (bottom right), Litter Bins (bottom left, inverted) and the top left map is set to a Master map, which aggregates the results of the other 3 maps, so in this example it’s showing the one place on the bottom of the map which has either a takeaway outlet or a convenience store, but no nearby litter bin.
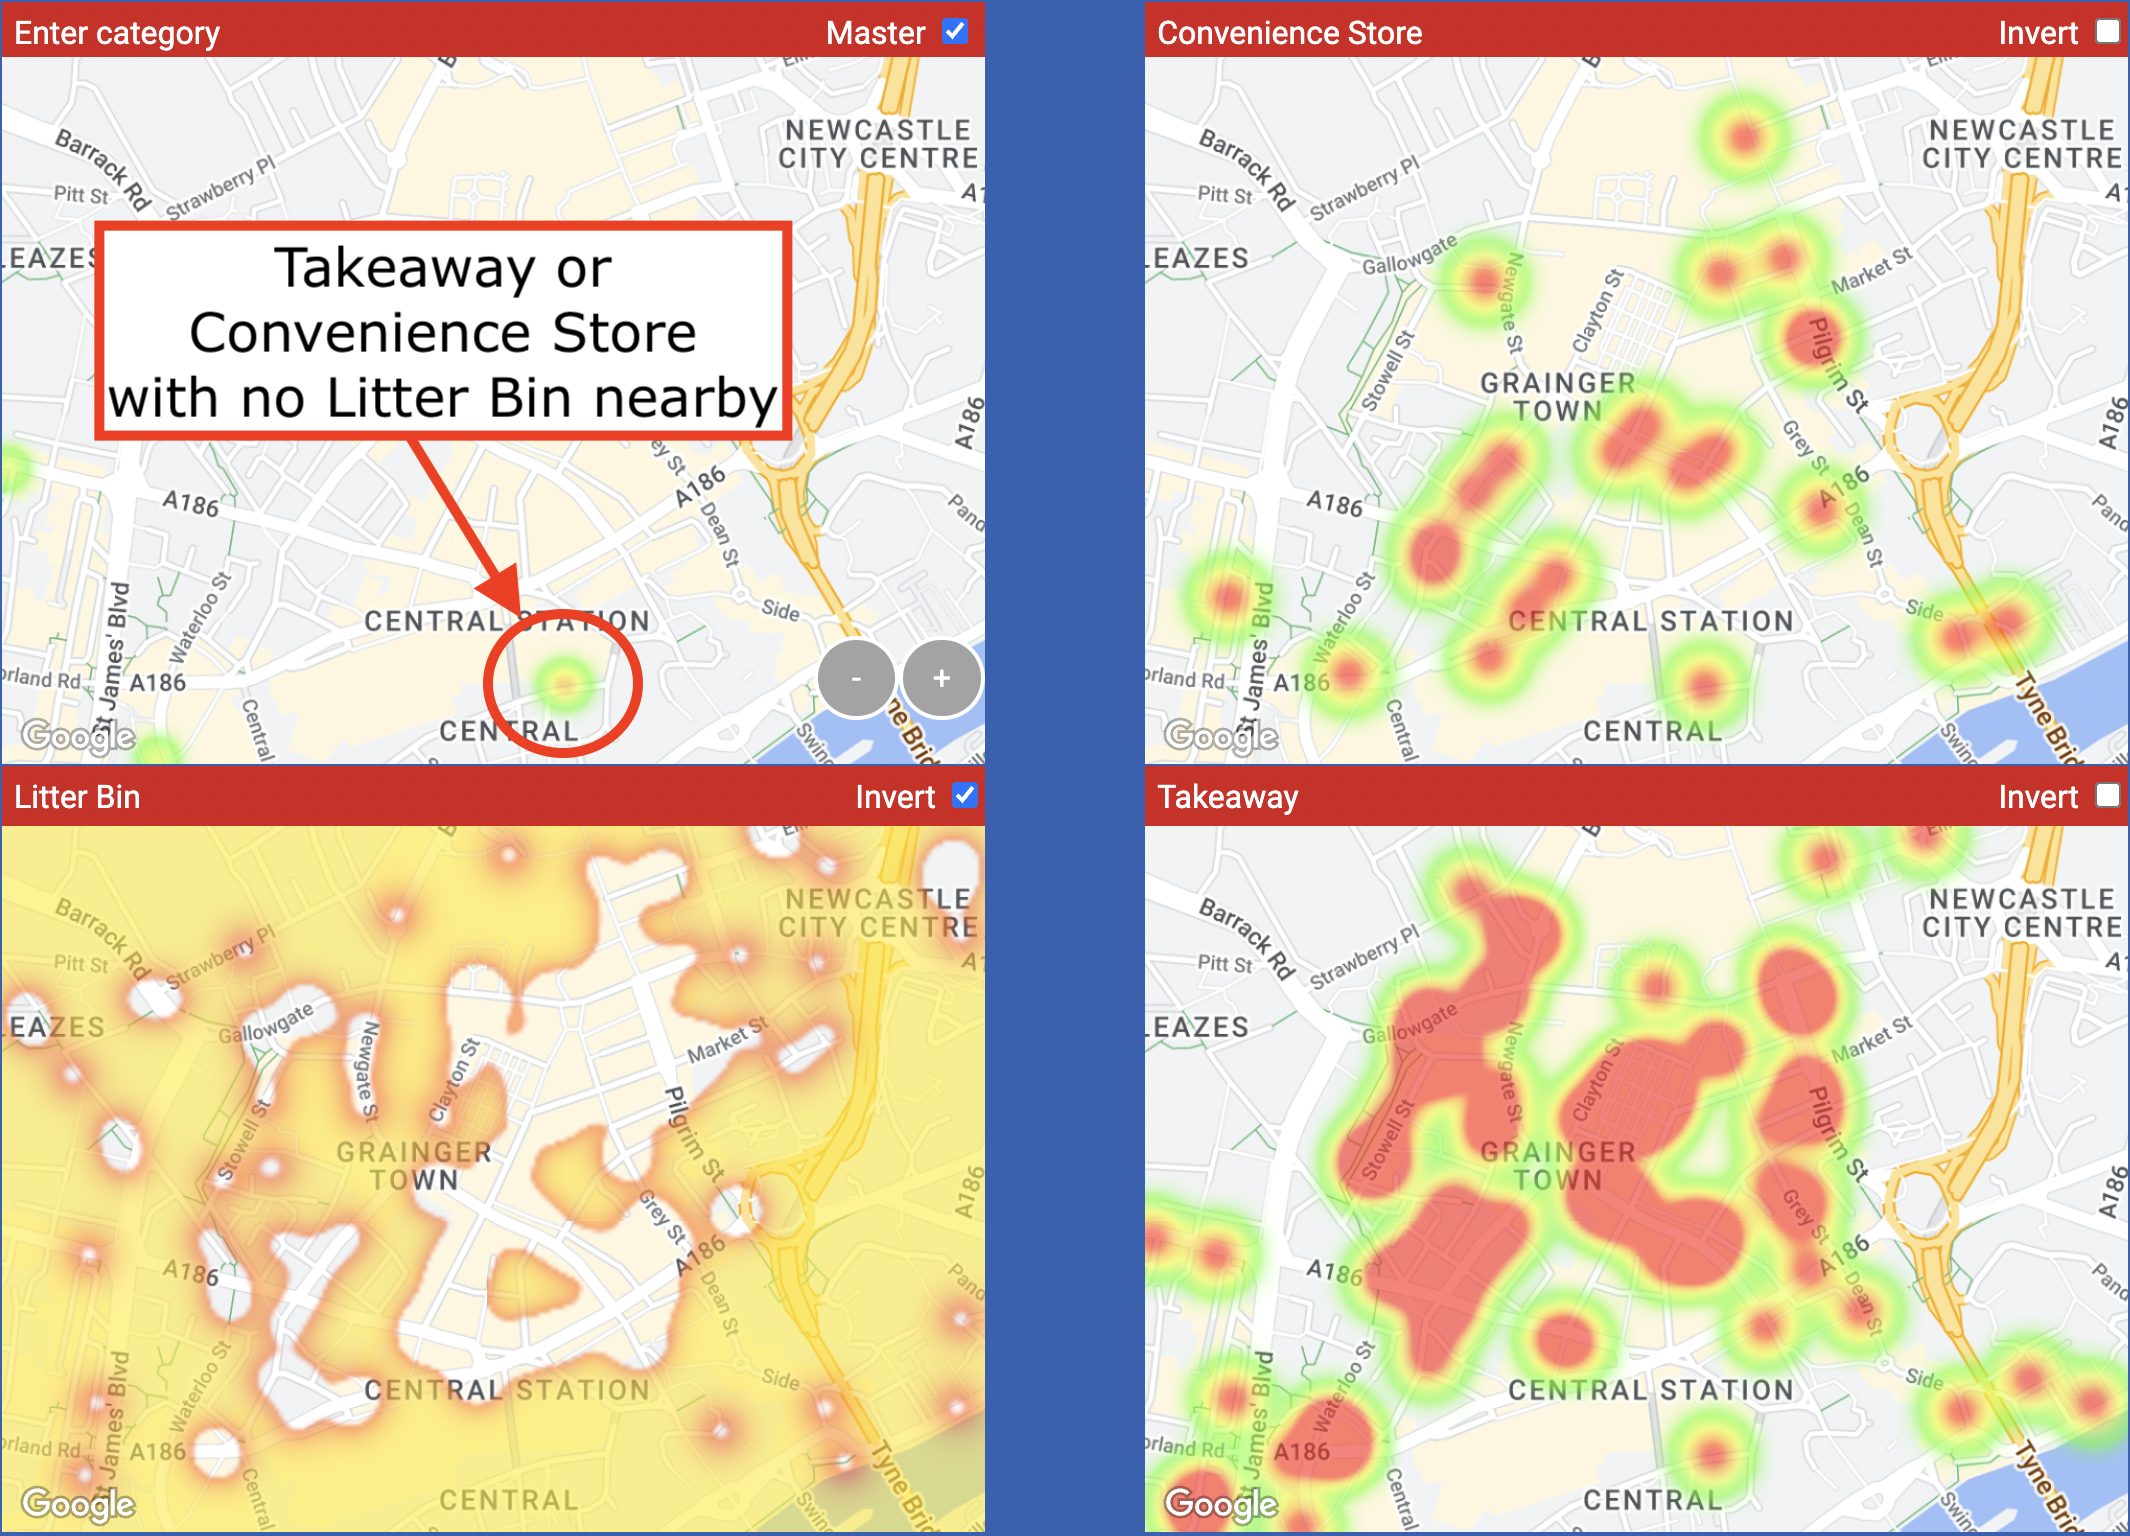
Fig 1 – Heat Map Analysis showing anywhere with a takeaway or convenience store but no litter bin nearby
High Resolution Images & Machine Learning
Our data-gathering agents stand in front of every street asset and photograph them, and the resulting high resolution images are so good that we can read the 3 inch label on a telecoms surface box lid.
These high resolution images allow us to use machine learning to add metadata to street assets. For example, our machine learning module cycled through more than 1,000 streetlamp column images from Newcastle City Centre in just 88 seconds and identified which streetlamps had additional apparatus attached (hanging baskets, flags, telecoms equipment, CCTV cameras, etc.).
Our street assets surveys can have up to 10,000 street assets per square kilometre, with 10,000 high resolution images per square kilometre. This databank of high resolution images sets Inakalum apart from other solution providers.
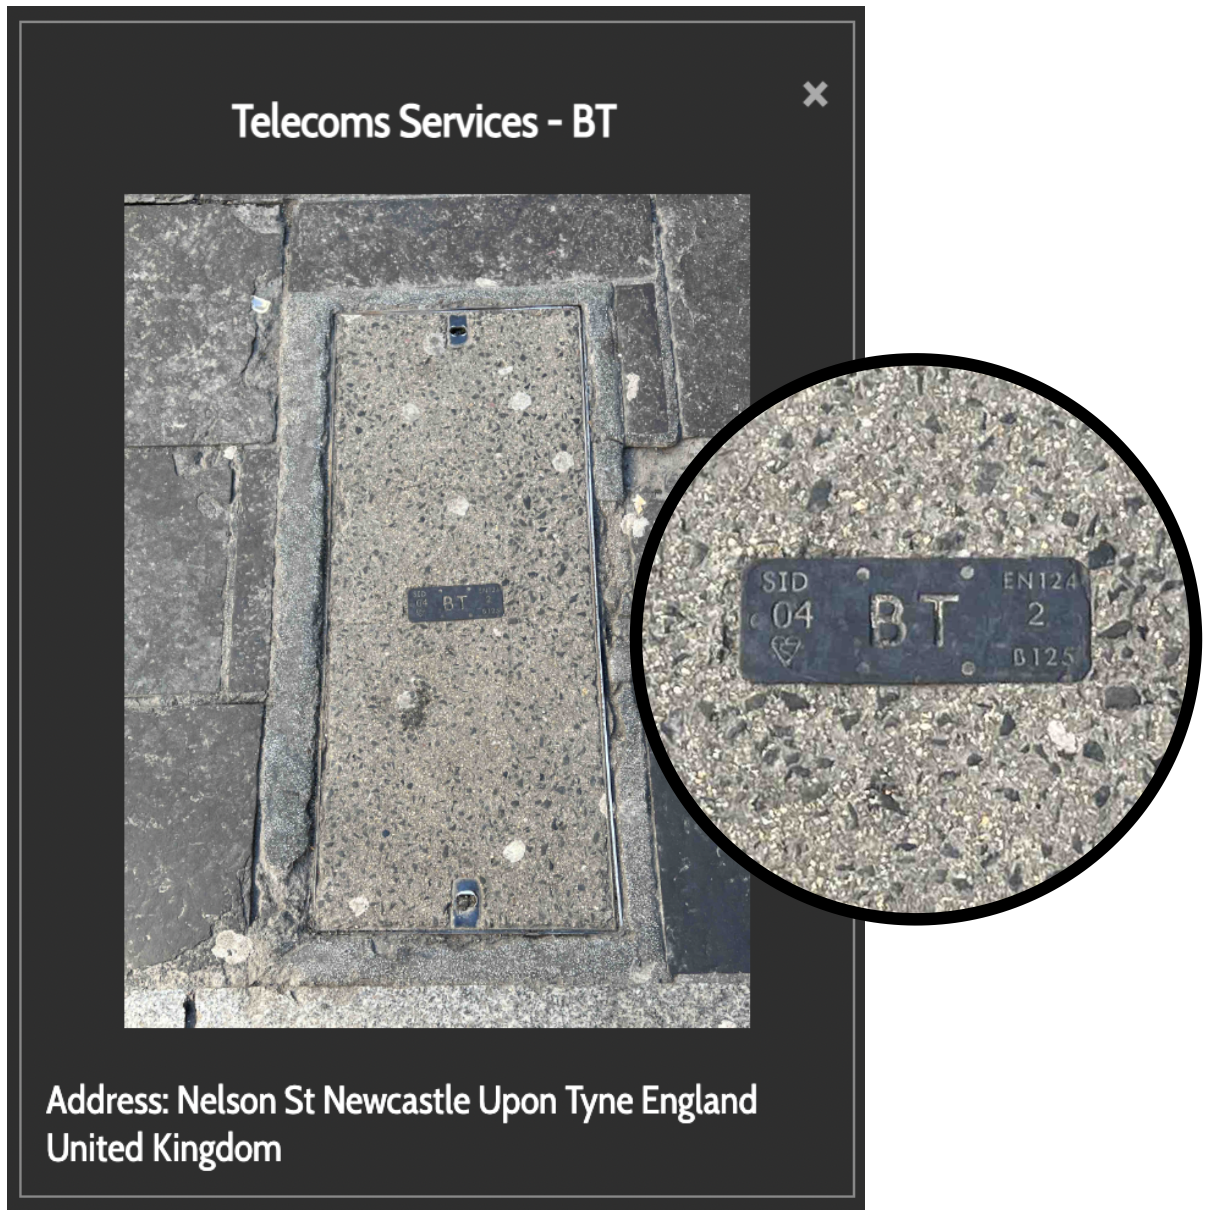
Individual High-Resolution Images of Every Street Asset
4G/5G Small Cell Street Asset Surveys
Cooperation between Local Authorities and Mobile Network Operators and their infrastructure partners is essential to accelerate the deployment of 4G/5G small cells in busy urban areas. Inakalum can help with the challenge of finding suitable street assets for hosting small cell equipment by surveying street assets suitable for hosting small cells (streetlamp columns, bus shelters, CCTV poles) and also the telecoms surface boxes nearby which could provide access to backhaul fibre.
Our analytical and machine learning tools can leverage our high resolution asset images to quickly find the most suitable street assets for hosting cells, eliminating the need for multiple site visits and significantly shortening the planning time for small cell installations.
Street Assets Surveys to help with 5G small cell deployments